Skip to content

Join Today

Member portal

NSW Teachers Federation
  • Home
  • Courses
    • All Courses
    • All Conferences
    • Primary
    • Secondary
  • Journal
    • Journal Issue
    • For your Classroom
    • For your Staffroom
    • For your Future
  • Podcast
  • About
    • Who we are
    • What we do
    • Our Presenters
    • FAQ
    • Contact Us

Subject: Mathematics

Move and Improve Mathematics: Middle Years

Martin Ommundsen finds that incorporating movement activities into Mathematics can contribute to positive impacts on learning and class dynamics…

If asked ‘What is good for the body, mind and spirit?’ a typical Mathematics teacher might answer ‘Maths!’

This author agrees and presents empirical research that targeted and regular inclusion of movement-based Mathematics pedagogy has beneficial learning outcomes for all students, including those who might typically be thought to be high achieving and coping well in more traditional, seated, classroom settings. The article sets out background research and context and goes on to detail findings for learning and social impacts, drawing on student voice and primary research, before presenting a series of examples for effective activities connected to the NSW syllabuses.

Background

The positive connection between physical activity and cognition has been understood since Sibley and Etnier’s meta-study from 2003. They concluded that the academic level of achievement in a range of different subjects, including mathematics, does not decrease when students spend increased time on physical activities in these subjects (Sibley & Etnier, 2003).

Five years later, Tomporowski and colleagues, in a further meta-study, stated that positive changes in children’s mental functions caused by physical education lessons are primarily seen in the executive functions. In other words, increased movement in physical education will be followed by increased self-control, short-term memory and cognitive flexibility (Tomporowski et al., 2008).

However, movement during school time can be many other things than those in dedicated subjects, such as NSW’s sport or Personal Development, Health and Physical Education (PDHPE). In my home country of Denmark, since 2014, it has been a requirement that students should do some kind of movement averaging 45 minutes per day. The aim of the new law was to bring a lot of movement activities or games into subjects like Mathematics, Danish, English and so on, building on an understanding that physical activity contributes positively to the learning output of students.

The findings below come from empirical research, including my own, which included students interviews with my Class 9 (aged around 15 years old), who frequently received Mathematics instruction involving planned moving games and activities. Their answers are used to understand how these ‘games’ are experienced from a student’s perspective, and in this article, their responses will be referred to as “Year 9 Student”.

Impact on learning

There is evidence that physical activity improves student learning. Danish studies report that in Mathematics, students in the youngest school classes can increase their mathematical skills by 35 per cent compared to students who do not have physical activities incorporated into their Mathematics lessons. An Australian study of NSW students at the older end of the age scale advocated that implementation of activities like high intensity interval training programs increased students’ fitness and improved their well-being with potential subsequent benefits to academic performance. (Lubens et al., 2019). However, according to brain researcher Jesper Lundbye-Jensen (Sederberg et al., 2017), for targeted impact on learning outcomes, it is necessary that the physical activities are connected to the subject itself and that they are not “just” a run around. In Mathematics, several cognitive dimensions can be improved, for example, problem solving, logical thinking, spatial perception, short-term memory and awareness.

Student experience and brain function

So, what about the Year 9 class? How did they experience these movement games and did they find the strategies helpful in their lessons? One of the students gives the following description:

You are really using your brain a lot while sitting and working, and you can get quite tired. It’s nice with a break halfway through, but you still stay in Mathematics. While moving you refresh what you’ve learned about prime numbers, square numbers or similar, and after that you are ready to work again.

Another student explains it like this:

It makes things more interesting. You get some oxygen to your brain. You don’t feel so tired. Some things you remember better this way, instead of writing them down.

There are several interesting key points to draw out from this. Firstly, the use of Mathematics when moving instead of sitting seem to freshen up the students. It is also important to remember that students are usually sitting down in all other subjects except for physical education, so moving activities can really bring a welcome change. Secondly, it apparently helped the students with the learning afterwards as well. Last but not least, it appears that certain concepts can be easier to remember, perhaps as the body embraces the knowledge in more than one way while moving. This last insight is also supported by other empirical research arguing that the brain develops when practising motor skills (Sederberg et al., 2017). Furthermore, the role of novelty is important here, as in an educational world where most learning is expected to occur whilst sitting at similar looking tables, in similar looking classrooms, the body and brain will more quickly remember the exact learning that happened when it was connected to distinct or novel movement activities in a different setting in the school yard or likewise.

Not only for disengaged

Some might think that movement activities are only or mainly for those students who struggle to sit in their seats doing usual work at tables. However, one of the Year 9 students explained how that was not correct.

Even though I would categorise myself as a student who is fully capable of sitting down for one hour and listening, I also find it good and welcome to do something where the academic work and physical activities are blended together.

From my own master thesis research, it was evident that movement activities are absolutely not only for students who are struggling with the normal classroom setting, but indeed for anyone in the classroom, regardless of academic level and gender. Interestingly, these findings have been very similar across very different countries, such as Denmark, Tanzania and Nepal (Ommundsen 2016). My own interpretation is that there could be a universal appreciation for such an incorporated model.

Careful selection is required

At this point, though, it is important to clarify that not all parts of the Mathematics syllabus can be met through such activities. In the first instance, it would obviously be too monotone and not very interesting. The Year 9 students identify certain areas where they find the physical activities fruitful. As example,

Repetition, very clearly! It could be something with questions and answers that are matching. For instance, equations, geometry or mental arithmetic tasks.

Repetition. Like calculation rules, prime numbers or square roots.

This suggests that it is important not to implement new, difficult, or complex Mathematics topics in the movement activity itself. Rather, aim to repeat some previously introduced concepts or areas and then allow the students to practice on that through the movement strategies. As a Mathematics teacher, that is a welcome opportunity to review some of those things you might not otherwise find the time for. Also, it can become easier to relate future discussions to something concrete, as for instance, when using prime numbers again, you can refer back to the physical experiences and say “remember, those were the ones we practiced when we did that activity outside…”.

Impact on social life

In addition to the positive impacts on learning outlined above, there can also be advantages for the social life and dynamics of the class as a group. Year 9 student responses on this specific matter illustrate a range of different, important points:

That’s a really important part (the social life) and one of the most important reasons to do it. When you’re together in groups, everybody is moving, and everyone is passionate. That creates a better teamwork. You build much more on your teamwork when there is some movement in the teaching.

You are talking and communicating more with people. You easily come around to each other. Maybe you come to chat to someone you usually aren’t talking to.

Maybe you get some fun memories with each other, you get a little closer with each other, because you have something you can look back on.

Other students interviewed over the years have expressed similar views; that movement activities provide a special mood in the classroom (or outdoor space) when these activities are going on. It would seem unnecessary here to argue further about why a good mood in the classroom is a positive factor.

Whereas in the normal classroom setting students are not usually meant to talk to very many other people, besides maybe their table partner and the teacher, the students in the movement activities pass a lot of other students simply because they are moving around to lots of different places. In my master’s thesis, I found that the students actually did not get disturbed by their classmates in these activities, something that I noticed tended to happen more frequently in the quiet (supposedly) classroom settings. The most likely reason why is that they are so engaged themselves by the activity (Ommundsen, 2016).

There are obviously different ways of creating fun memories together, but the theory of science of body phenomenology argues that the body plays a distinctly important role. Merleau-Ponty (1994) argues that bodies have a will for some kind of freedom. Steen Nepper Larsen further explains how the motorical system operates prior to consciousness so that We can, before we know[i]. It has been my experience that movement activities in and of themselves often help create those important fun memories that build the class up together.

Movement activities linked to the NSW syllabuses

Thus, having argued that there are several benefits, some specific examples of activities to try are included below. All of the following are activities I have had good success with and each is connected to some relevant syllabus outcomes. The suggestions below are designed to give an indication of starting points and it is anticipated that Mathematics teachers could find many ways to modify and extend these to suit their students.

Tall, broad, thin, low

Method

  • Most likely to be done inside the classroom.
  • The teacher writes the following on the board:
    • 76-100: tall
    • 51-75: broad
    • 26-50: thin
    • 1-25: low
  • The students are given (the teacher can write on the board) different questions like: 3 x 8 – 2. Students can use lots of different combined calculation methods and indicate their answer by manipulating their body to reflect the category for the range the answer falls into. In this example, the result is 22, and so all students should make themselves as low to the ground as possible.
  • Divide the students into two or three groups and let them compete against each other, or make a class challenge to notice how fast the whole class can do ten questions.
  • Raise the difficulty by using percentage. For example, “How much is 25% of 240?” In this case, using the same range above, the answer is 60, and so students make themselves as broad as possible.

NSW syllabus outcomes

  • MA3-6NA: selects and applies appropriate strategies for multiplication and division, and applies the order of operations to calculations involving more than one operation
  • MA4-5NA: operates with fractions, decimals and percentages
     

True or false

Method

  • Most likely to be done outside or in a big hall.
  • The students are divided into two teams. On each team the members stand in a line next to each other, all facing the opponent team. There should be approximately two steps between the two lines, each student facing a student from the opposite team.
  • A “goal line” is marked about 10 m behind each line of the students.
  • One of teams is the true team, the other is the false team.
  • If the teacher says something which is true, the true team turns around and runs back to their own goal line for safety while the false team tries to catch them. If they teacher says something which is false, the false team has to turn around and run back to their own goal line for safety, and the true team has to try to catch them. So, if the teacher says, “A triangle consists of 190 degrees”, the false team runs back to their goal line and the true team tries to catch them.
  • If someone is caught before the goal line, this student will go on the other team when the students are lining up to the next question. When doing this activity the first time, it can appear a bit confusing, but the students will soon learn it.
  • For making it easier, the teacher can make a break before saying the last part of a sentence, for example “5 x 5 x 2 equals… [pause]… 50”. Then students are given a better chance to calculate.
  • Play for a set period of time, until one side has caught 10 players from the other team, or until one team is fully captured.

NSW syllabus outcomes

  • MA3-6NA: describes and compares length and distances using everyday language
  • MA3-7NA: compares, orders and calculate with fractions, decimals and percentages
  • MA4-6N4: solves financial problems involving purchasing goods

One in the middle

Method

  • Most likely to be done outside or in a big hall.
  • The whole class stand in a big circle, each student standing at a spot (marked by a cone/textbook/chair), with one student in the centre of the circle.
  • Every participant is given one of four different numbers (for example 6, 7, 8, 9).
  • The teacher calls out a larger number which is a product of one or more of the four selected numbers (for example 21, 24, 72). The students who have the relevant number(s) run from their place to another vacated place around the circle (several will always be free at the same time as there are only four numbers allocated).
  • Importantly, the student in the centre also has to find a free spot each time, and so every time there will be one student who does not find a spot, and this person will be the new person in the middle for the next round.
  • Change the numbers after 5-10 minutes and remember, even though it is a very fun game it is supposed to be a ‘brain break’ and so not consume the whole lesson.
  • Note. This game works well for other subjects such as English or languages, with four words allocated and teachers calling out categories, so please consider sharing with your colleagues.

NSW syllabus outcomes

  • MA2-6NA: uses mental and informal written strategies for multiplications and division
  • MA3-6NA: selects and applies appropriate strategies for multiplication and division, and applies the order of operations to calculations involving more than one operation

Over to you!

The benefits of physical activity are well understood in health fields, and finding ways to incorporate this knowledge into the school experience is a challenge which, if achieved, could have significant advantages. The strategies outlined in this article suggest that thoughtful integration of subject-specific movement activities into teaching programs can bring improvement in mathematical understanding as well as potential gains in student wellbeing and class cohesion for the full range of students in the middle years.

References:

Lubens, D., Leahy, A., Smith, J., & Eather N. (2019). Why exercise for cognitive and mental health is especially important in the senior years. Journal of Professional Learning, (2). https://cpl.nswtf.org.au/journal/semester-2-2019/why-exercise-for-cognitive-and-mental-health-is-especially-important-in-the

Merleau-Ponty, M. (1994). Kroppens fænomenologi [Phenomenology of perception]. Det lille Forlag.

Ommundsen, M. S. (2016). Når det sociale mønster i skolen bevæger sig [unpublished Master’s thesis]. Aarhus Universitet.

Sederberg, M., Kortbek, K., & Bahrenscheer, A. (2017). Bevægelse, sundhed og trivsel: I skole og fritid. Hans Reitzels Forlag.

Sibley, B. A., & Etnier, J. L. (2003). The relationship between physical activity and cognition in children: A meta-analysis. Pediatric Exercise Science, 15(3), 243-256.

Tomporowski, P. D., Davis, C. L., Miller, P. H., & Naglieri, J. A. (2008). Exercise and children’s intelligence, cognition, and academic achievement. Educational Psychology Review, 20(2), 111-131.

Martin Ommundsen is a Mathematics, History, Social Science and Physical Education teacher educated in Denmark. He now lives in Australia and has experience teaching students from Year 1 to Year 9 in a range of cultures and countries including Tanzania and Nepal. Martin completed a Masters Degree at Aarhus University in 2016 and his research interests and final thesis include the sociological aspects of movement activities in the classroom.


[i] This observation was made by Professor Steen Nepper Larsen during a lecture at Aarhus University, Denmark, in 2015.


Uncertainty, Error and Confidence in Data

Jim Sturgiss provides a straightforward guide to teaching some scientific concepts that are now part of the new Science syllabuses…

Uncertainty is a statistical concept found in the Assessing data and information outcome of the new Science syllabuses:.

WS 5.2 assess error, uncertainty and limitations in data (ACSBL004, ACSBL005, ACSBL033, ACSBL099)
This concept is not found in the previous syllabuses.
This paper addresses uncertainty as a means of describing the accuracy of a series of measurements or as a means of comparing two sets of data. Uncertainty, or confidence, is described in terms of mean and standard deviation of a dataset. Standard deviation is a concept encountered by students in Stage 5.3 Mathematics and Stage 6 Standard 2 Mathematics.
Not explored in this paper is the use of Microsoft Excel or Google Sheets which can calculate uncertainty of datasets with ease (=STDEV.S(number1, number2,…).

Figure 1 Karl Pearson

Karl Pearson (Figure 1), the great 19th-century biostatistician and eugenist, first described mathematical methods for determining the probability distributions of scientific measurements, and these methods form the basis of statistical applications in scientific research. Statistical techniques allow us to estimate uncertainty and report the error surrounding a value after repeated measurement of that value.

1. Accuracy, Precision and Error

Accuracy is how close a measurement is to the correct value for that measurement. The precision of a measurement system refers to how close the agreement is between repeated measurements (which are repeated under the same conditions). Measurements can be both accurate and precise, accurate but not precise, precise but not accurate, or neither.

Precision and Imprecision

Precision (see Figure 2) refers to how well measurements agree with each other in multiple tests. Random error, or Imprecision, is usually quantified by calculating the coefficient of variation from the results of a set of duplicate measurements.

Figure 2 Accuracy and precision

The accuracy of a measurement is how close a result comes to the true value.

Error

When randomness is attributed to errors, they are “errors” in the sense in which that term is used in statistics.

  • Systematic error (bias) occurs with the same value, when we use the instrument in the same way (eg calibration error) and in the same case. This is sometimes called statistical bias.

It may often be reduced with standardized procedures. Part of the learning process in the various sciences is learning how to use standard instruments and protocols so as to minimize systematic error.

  • Random error, which may vary from one observation to another. Random error (or random variation) is due to factors which cannot, or will not, be controlled. Random error often occurs when instruments are pushed to the extremes of their operating limits. For example, it is common for digital balances to exhibit random error in their least significant digit. Three measurements of a single object might read something like 0.9111g, 0.9110g, and 0.9112g.

Systematic error or Inaccuracy (see Figure 3) is quantified by the average difference (bias) between a set of measurements obtained with the test method with a reference value or values obtained with a reference method.


Figure 3 Imprecision and in accuracy

2. Uncertainty

There is uncertainty in all scientific data. Uncertainty is reported in terms of confidence.

  • Uncertainty is the quantitative estimation of error present in data; all measurements contain some uncertainty generated through systematic error and/or random error.
  • Acknowledging the uncertainty of data is an important component of reporting the results of scientific investigation.
  • Careful methodology can reduce uncertainty by correcting for systematic error and minimizing random error. However, uncertainty can never be reduced to zero.

Estimating the Experimental Uncertainty For a Single Measurement

Any measurement made will have some uncertainty associated with it, no matter the precision of the measuring tool. So how is this uncertainty determined and reported?

The uncertainty of a single measurement is limited by the precision and accuracy of the measuring instrument, along with any other factors that might affect the ability of the experimenter to make the measurement.

For example, if you are trying to use a ruler to measure the diameter of a tennis ball, the uncertainty might be ± 5 mm, but if you used a Vernier caliper, the uncertainty could be reduced to maybe ± 2 mm. The limiting factor with the ruler is parallax, while the second case is limited by ambiguity in the definition of the tennis ball’s diameter (it’s fuzzy!). In both of these cases, the uncertainty is greater than the smallest divisions marked on the measuring tool (likely 1 mm and 0.05 mm respectively).

Unfortunately, there is no general rule for determining the uncertainty in all measurements. The experimenter is the one who can best evaluate and quantify the uncertainty of a measurement based on all the possible factors that affect the result. Therefore, the person making the measurement has the obligation to make the best judgment possible and to report the uncertainty in a way that clearly explains what the uncertainty represents:

Measurement = (measured value ± standard uncertainty) unit of measurement.
For example, where the ± standard uncertainty indicates approximately a 68% confidence interval, the diameter of the tennis ball may be written as 6.7 ± 0.2 cm.
Alternatively, where the ± standard uncertainty indicates approximately a 95% confidence interval, the diameter of the tennis ball may be written as 6.7 ± 0.4 cm.

Estimating the Experimental Uncertainty For a Repeated Measure (Standard Deviation).

Suppose you time the period of oscillation of a pendulum using a digital instrument (that you assume is measuring accurately) and find: T = 0.44 seconds. This single measurement of the period suggests a precision of ±0.005 s, but this instrument precision may not give a complete sense of the uncertainty. If you repeat the measurement several times and examine the variation among the measured values, you can get a better idea of the uncertainty in the period.

For example, here are the results of 5 measurements, in seconds: 0.46, 0.44, 0.45, 0.44, 0.41.

For this situation, the best estimate of the period is the average, or mean.

Whenever possible, repeat a measurement several times and average the results. This average is generally the best estimate of the “true” value (unless the data set is skewed by one or more outliers). These outliers should be examined to determine if they are bad data points, which should be omitted from the average, or valid measurements that require further investigation.

Generally, the more repetitions you make of a measurement, the better this estimate will be, but be careful to avoid wasting time taking more measurements than is necessary for the precision required.

Consider, as another example, the measurement of the thickness of a piece of paper using a micrometer. The thickness of the paper is measured at a number of points on the sheet, and the values obtained are entered in a data table.

This average is the best available estimate of the thickness of the piece of paper, but it is certainly not exact. We would have to average an infinite number of measurements to approach the true mean value, and even then, we are not guaranteed that the mean value is accurate because there is still some systematic error from the measuring tool, which can never be calibrated perfectly. So how do we express the uncertainty in our average value?

The most common way to describe the spread or uncertainty of the data is the standard deviation

Figure 5 Standard deviations of a normal distribution

The significance of the standard deviation is this:

if you now make one more measurement using the same micrometer, you can reasonably expect (with about 68% confidence) that the new measurement will be within 0.002 mm of the estimated average of 0.065 mm. In fact, it is reasonable to use the standard deviation as the uncertainty associated with this single new measurement.

This is written:
The thickness of 80 gsm paper (n=5) averaged 0.065 (s = 0.002mm)
           s = standard deviation
OR
The thickness of 80 gsm paper (n=5) averaged 0.065 ± 0.004 mm to a 95% confidence level.
(0.004 mm represents 2 standard deviations, 2s)

Standard Deviation of the Means (Standard Error of Mean (SEM))

The standard error is a measure of the accuracy of the estimate of the mean from the true or reference value. The main use of the standard error of the mean is to give confidence intervals around the estimated means for normally distributed data, not for the data itself but for the mean.

If measured values are averaged, then the mean measurement value has a much smaller uncertainty, equal to the standard error of the mean, which is the standard deviation divided by the square root of the number of measurements.

Standard error is often us
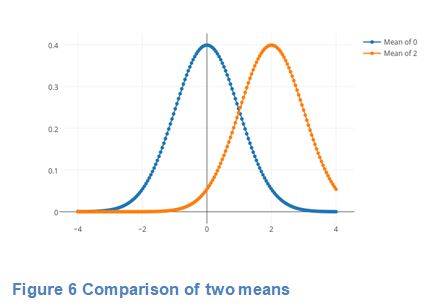
ed to test (in terms of null hypothesis testing) differences between means.

For example, two populations of salmon fed on two different diets may be considered significantly different if the 95% confidence intervals (two std errors) around the estimated fish sizes under Diet A do not cross the estimated mean fish size under Diet B.

Note that the standard error of the mean depends on the sample size, as the standard error of the mean shrinks to 0 as sample size increases to infinity.

Figure 7 Salmon

Standard Error of Mean (SEM) Versus Standard Deviation

In scientific and technical literature, experimental data are often summarized either using the mean and standard deviation of the sample data or the mean with the standard error. This often leads to confusion about their interchangeability. However, the mean and standard deviation are descriptive statistics, whereas the standard error of the mean is descriptive of the random sampling process.

The standard deviation of the sample data is a description of the variation in measurements, whereas, the standard error of the mean is a probabilistic statement about how the sample size will provide a better bound on estimates of the population mean, in light of the central limit theorem.

Put simply, the standard error of the sample mean is an estimate of how far the sample mean is likely to be from the population mean, whereas the standard deviation of the sample is the degree to which individuals within the sample differ from the sample mean. If the population standard deviation is finite, the standard error of the mean of the sample will tend to zero with increasing sample size. This is because the estimate of the population mean will improve, while the standard deviation of the sample will tend to approximate the population standard deviation as the sample size increases.

Confidence Levels

The confidence level represents the frequency (i.e. the proportion) of possible confidence intervals that contain the true value of the unknown population parameter. Most commonly, the 95.4% (“two sigma”) confidence level is used. However, other confidence levels can be used, for example, 68.3% (“one sigma”) and 99.7% (“three sigma”).

Conclusion

Knowledge of normally distributed data and standard deviation are key to understanding the notions of statistical uncercertainty and confidence. These concepts are extended to the standard error of mean so that the significance of differences between two related datasets can be determined.

Glossary

Absolute error The absolute error of a measurement is half of the smallest unit on the measuring device. The smallest unit is called the precision of the device.

Array An array is an ordered collection of objects or numbers arranged in rows and columns.

Bias This generally refers to a systematic favouring of certain outcomes more than others, due to unfair influence (knowingly or otherwise).

Confidence level The probability that the value of a parameter falls within a specified range of values. For example 2s = 95% confidence level.

Data cleansing Detecting and removing errors and inconsistencies from data in order to improve the quality of data (also known as data scrubbing).

Data set An organised collection of data.

Descriptive statistics These are statistics that quantitatively describe or summarise features of a collection of information.

Large data sets Data sets that must be of a size to be statistically reliable and require computational analysis to reveal patterns, trends and associations.

Limits of accuracy The limits of accuracy for a recorded measurement are the possible upper and lower bounds for the actual measurement.

Measures of central tendency Measures of central tendency are the values about which the set of data values for a particular variable are scattered. They are a measure of the centre or location of the data. The two most common measures of central tendency are the mean and the median.

Measures of spread Measures of spread describe how similar or varied the set of data values are for a particular variable. Common measures of spread include the range, combinations of quantiles (deciles, quartiles, percentiles), the interquartile range, variance and standard deviation.

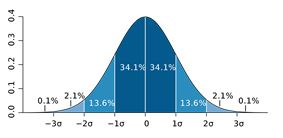
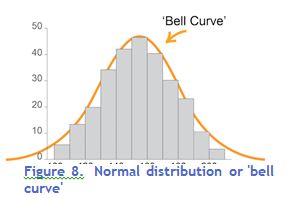
Normal distribution The normal distribution is a type of continuous distribution whose graph looks like this:

The mean, median and mode are equal and the scores are symmetrically arranged either side of the mean.

The graph of a normal distribution is often called a ‘bell curve’ due to its shape.

Reliability An extent to which repeated observations and/or measurements taken under identical circumstances will yield similar results.

Sampling This is the selection of a subset of data from a statistical population. Methods of sampling include:

  • systematic sampling – sample data is selected from a random starting point, using a fixed periodic interval
  • self-selecting sampling – non-probability sampling where individuals volunteer themselves to be part of a sample
  • simple random sampling – sample data is chosen at random; each member has an equal probability of being chosen
  • stratified sampling – after dividing the population into separate groups or strata, a random sample is then taken from each group/strata in an equivalent proportion to the size of that group/strata in the population
  • A sample can be used to estimate the characteristics of the statistical population.

Standard deviation This is a measure of the spread of a data set. It gives an indication of how far, on average, individual data values are spread from the mean.

Standard error The standard error of the mean (SEM) is the standard deviation of the sampling distribution of the mean.

Uncertainty Any single value has an uncertainty equal to the standard deviation. However, if the

values are averaged, then the mean measurement value has a much smaller uncertainty, equal to the standard error of the mean, which is the standard deviation divided by the square root of the number of measurements.

Works Cited

Measurements and Error Analysis, www.webassign.net/question_assets/unccolphysmechl1/measurements/manual.html.

Altman, Douglas G, and J Martin Bland. “Standard Deviations and Standard Errors.” BMJ (Clinical Research Ed.), BMJ Publishing Group Ltd., 15 Oct. 2005, www.ncbi.nlm.nih.gov/pmc/articles/PMC1255808/.

Hertzog, Lionel. “Standard Deviation vs Standard Error.” DataScience , 28 Apr. 2017, https://datascienceplus.com/standard-deviation-vs-standard-error/

Mott, Vallerie. “Introduction to Chemistry.”
https://courses.lumenlearning.com/introchem/chapter/accuracy-precision-and-error/

Schoonjans, Frank. “Definition of Accuracy and Precision.” MedCalc, MedCalc Software, 9 Nov. 2018, www.medcalc.org/manual/accuracy_precision.php.

“Standard Error.” Wikipedia, Wikimedia Foundation, 7 Mar. 2019,
https://en.wikipedia.org/wiki/Standard_error

2336 | NSW Education Standards, 
https://educationstandards.nsw.edu.au/wps/portal/nesa/11-12/stage-6-learning-areas/stage-6-science/biology-2017/content/2336

1319 | NSW Education Standards, https://educationstandards.nsw.edu.au/wps/portal/nesa/11-12/stage-6-learning-areas/stage-6-mathematics/mathematics-standard-2017/content/1319

Jim is an educational researcher and independent educational consultant. His M.Ed (Hons) thesis used an experimental design to evaluate the effectiveness of a literacy and learning program (1997). A recipient of the NSW Professional Teaching Council’s Distinguished Service Award for leadership in delivering targeted professional learning to teachers, he works with schools to align assessment, reporting and learning practice. He has been a head teacher of Science in two large Sydney high schools, as well as HSC Chemistry Senior Marker and Judge. For many years he served as a DoE Senior Assessment Advisor where he developed many statewide assessments, (ESSA, SNAP, ELLA, BST) and as Coordinator: Analytics where he developed reports to schools for statewide assessments and NAPLAN. He is a contributing author to the new Pearson Chemistry for NSW and to Macquarie University’s HSC Study Lab for Physics.

Follow Me into the Butterfly Garden

Neil Bramsen explores butterflies while teaching Mathematics and Science…

I am always keen to have my students undertake at least one major project based learning (PBL) experience each year.

In mid-2016 I had my stage two class work on revitalising an overgrown and neglected garden area into a ‘Butterfly Garden’. I was inspired by my visit to High Tech High in Chula Vista a few years ago where I saw a comprehensive PBL program in place, with a butterfly component including garden, plant propagation, egg collection and breeding, all supported by student-generated text and a website.

Talk about comprehensive!

Beginnings

Exploring regional butterflies and appropriate feeder plants introduced a strong environmental and biodiversity perspective as students considered the ecology of a butterfly habitat. Over the course of six months it was rewarding to document and reflect on the process that covered a multitude of learning areas, such as measurement and science and information reports, as well as the physical tasks of gardening and assembling materials.

Of course, PBL is a terrific way to ‘access’ this type of learning, and each student was able to achieve success through various entry and exit points that they could identify with. Key Learning Areas (KLA) such as Mathematics, Science, English and PDHPE came into play and offered a broad scope of learning opportunities.

I have found with any PBL that backward mapping to outcomes is the pragmatic and practical approach. I consider the activities that may be undertaken and then explore the relevant KLA scope and cross reference to the syllabus involved.

Measuring up

There was extensive use of measurement, both through aerial photography via a DJI Phantom Drone and scale and grid tasks that calculated the area of the garden and path. See a photograph below of the original site taken by the drone.

This measurement work then evolved into a volume activity for more capable students, and the depth of mulch and crushed concrete was calculated. It is important to note that while all students had an introduction or refresher to area and square metres for example, I then targeted students that were stretching themselves to explore volume and cubic metres.

The students used websites to source local materials, cost the materials and then ring the landscape company to place the order. They actually used the school credit card under my supervision (I had the CVV number) to ring and talk to the supplier and arrange the delivery. The students mapped access to the area.

Becoming alive

Highlights of the project included in-depth research into local butterflies and suitable host plants. The class explored colour and the types of colour needed to attract butterflies. Interestingly, while we initially focused on local plant species and native butterflies, the monarch butterfly and the need for the milkweed plant to support it were identified. We sourced milkweed, and this aspect has been the most successful, albeit with some winter wind damage to the milkweed. Propagating more milkweed plants would become an ongoing focus.

Importantly, as the image above demonstrates, the project all came together as students physically engaged with and enjoyed the gardening, from clearing weeds and moving barrow loads of mulch to pouring crushed aggregate to make the path. The area came to life as the seedlings and young plants began to mature.

A little organisation

Students also followed a product procedure to assemble timber benches so that the area was a welcoming learning space. A daily watering regime was added to the class task list, and deep saucers were added for birds and to provide water for butterflies.

The photograph above shows that, as the area established, it was then used for nature sketching, quiet time, reading and sensory awareness activities by the class.

Rewards worth working for

By late summer and autumn, we began to see monarch butterflies in the garden, just like the one in the photograph below. With some of the students that participated in the PBL project, we carefully examined the milkweed plants, which act as a host for egg-laying and monarch caterpillars. Not only did we find quite a few eggs on the leaf tips but also fifteen or so caterpillars in varying stages of maturity.

The kids were totally over the moon with the evidence of success and at seeing a natural life cycle occurring in the habitat that they had helped create. We are looking forward to monitoring the health of the garden and the number of monarch butterflies that mature. The garden has continued to be popular with my classes for nature sketching and quiet time and has now been dedicated as a special Year 6 Quiet Area during breaks.

Now, back to the syllabus

The project was an engaging opportunity to introduce teaching points from both the Mathematics and Science syllabuses. Some relevant outcomes are listed below.

Mathematics Stage 2 and Stage 3 outcomes

  • selects and uses the appropriate unit and device to measure lengths and distances, calculates perimeters, and converts between units of length MA3-9MG
  • measures, records, compares and estimates areas using square centimetres and square metres MA2-10MG
  • selects and uses the appropriate unit to calculate areas, including areas of squares, rectangles and triangles MA3-10MG
  • selects and uses appropriate mental or written strategies, or technology, to solve problems MA2-2WM
  • selects and applies appropriate problem-solving strategies, including the use of digital technologies, in undertaking investigations MA3-2WM
  • uses simple maps and grids to represent position and follow routes, including using compass directions MA2-17MG

Science Stage 2 and Stage 3 outcomes

  • shows interest in and enthusiasm for science and technology, responding to their curiosity, questions and perceived needs, wants and opportunities ST2-1VA
  • describes ways that science knowledge helps people understand the effect of their actions on the environment and on the survival of living things ST2-11LW
  • investigates their questions and predictions by analysing collected data, suggesting explanations for their findings, and communicating and reflecting on the processes undertaken ST2-4WS
  • describes that living things have life cycles, can be distinguished from non-living things and grouped, based on their observable features ST2-10LW
  • describes how people interact within built environments and the factors considered in their design and construction ST2-14BE
  • describes some physical conditions of the environment and how these affect the growth and survival of living things ST3-11LW

Keys to success

Before attempting your own special learning experience, consider and plan for the following:

  • Identify suitable project opportunities in the school grounds or local community;
  • Consider the teaching and learning outcomes and prepare to backward map the obvious outcomes while allowing for the unexpected. The opportunities for differentiated learning are extensive and every student can achieve success and growth in some aspect of learning;
  • Allocate sufficient time; PBL takes time, usually more time than you might think!;
  • Allocate resources and funding if needed;
  • Communicate to other classes, teachers and supervisors the aims and progress of the project to generate community and school ‘buy in’.

We can nurture many positive blooms through our school garden projects. Once your project has concluded, remember to celebrate the successes and share your experiences and new knowledge with your school and community.

Neil Bramsen is an Assistant Principal at Mount Ousley Public School, Wollongong. He actively engages with ‘the outdoor classroom’ and enjoys citizen science and space science. He is the recipient of the 2017 Prime Minister’s Prize for Excellence in Primary Science Teaching.

To follow Neil further use: @galaxyinvader and neilbramsen.edublogs.org.au

This is an updated version of the article published in STANSW Science Education News, 2017 Volume 66 Number 4, http://joom.ag/nTUL/p58. Visit STANSW’s website at: www.stansw.asn.au  

An Introduction to the New Stage 6 Mathematics Advanced and Extension Syllabuses

Terry Moriarty introduces the new calculus-based courses to be implemented from 2019…

The new NSW Stage 6 Mathematics Advance and Extension Syllabuses were endorsed in 2017. 2018 is a planning year with implementation for Year 11 in 2019 and Year 12 in 2020. There are support materials, such as sample scope and sequence and assessment tasks, available through the NSW Education Standards Authority (NESA) website.

Due to the online nature of the syllabus documents, teachers are encouraged to download and review each section, including the aim and rationale before moving to the course content. New features of the Stage 6 syllabuses and common material include:

  • Australian curriculum content identified by codes;
  • Learning across the curriculum content, including cross-curriculum priorities, general capabilities and other learning across curriculum areas, are incorporated and identified by icons;
  • An interactive glossary.

Additionally, the Mathematics syllabuses include coding of applications and modelling as integral parts of each strand. Some strands are now merged together and the Mathematics Advanced and Mathematics Standard syllabuses contain common material which is identified by a ‘paperclip’ icon.

Mathematics Advanced

Mathematics Advanced replaces the previous Mathematics 2 Unit syllabus. There is a new organisational structure as well as updates to content.

The Year 11 organisational structure

The Advanced course is organised into Strands, with the strands divided into Topics and Sub-topics. Topics within the strands have been updated, including some content from different topics in the current course, such as Functions, which includes Linear and Trigonometric Functions, as well as new topics.

What to look out for

Some of the topics below have not been included in the new courses:

  • Plane Geometry;
  • Coordinate Methods in Geometry;
  • Harder Applications as a topic;
  • Conics.

Some of the topics below have been updated, including some units from different topics:

  • Working with Functions includes Linear, Quadratic and Cubic Functions;
  • Trigonometry and Measure of Angles, includes the use of two and three dimensions as well as new topics;
  • Velocity and acceleration are included in Introduction to Differentiation;
  • Financial Mathematics involves sequences and series and their application to financial situations.

Mathematics Advanced: Content

The table below demonstrates the changes between the previous and new syllabus.

2 Unit Preliminary

(current in 2018)

New Mathematics Advanced Year 11 Course – Topics and Sub-topics (to be implemented in 2019)
  • Basic Arithmetic and Algebra
     
  • Real functions
     
  • Trigonometric ratios
     
  • Linear functions
     
  • The quadratic polynomial and the parabola
     
  • Plane geometry – geometrical properties
     
  • Tangent to a curve and derivative of a function

Functions

MA-F1 Working with Functions

Trigonometric Functions

MA-T1 Trigonometry and Measure of Angles

MA-T2 Trigonometric Functions and Identities

Calculus

MA-C1 Introduction to Differentiation

Exponential and Logarithmic Functions

MA-E1 Logarithms and Exponentials

Statistical Analysis

MA-S1 Probability and Discrete Probability Distributions

2 Unit HSC Course

(Current until 2019)

New Mathematics Advanced Year 12 Course – Topics and Sub-topics (to be implemented in 2020)
  • Coordinate methods in geometry
  • Applications of geometrical properties
  • Geometrical applications of differentiation
  • Integration
  • Trigonometric functions
  • Logarithmic and exponential functions
  • Applications of calculus to the physical world
  • Probability
  • Series and series applications

Functions

MA-F2 Graphing Techniques

Trigonometric Functions

MA-T3 Trigonometric Functions and Graphs

Calculus

MA-C2 Differential Calculus

MA-C3 The Second Derivative

MA-C4 Integral Calculus

Financial Mathematics

MA-M1 Modelling Financial Situations

Statistical Analysis

MA-S2 Descriptive Statistics and Bivariate Data Analysis

MA-S3 Random Variables

Mathematics Extension 1: Content

The table below demonstrates the changes between the previous and new syllabus.

3 Unit Preliminary Course

(current in 2018)

New Mathematics Extension 1 Year 11 Course – Topics and Sub-topics (to be implemented in 2019)
  • Other inequalities
  • Circle geometry
  • Further trigonometry
  • Angles between two lines
  • Internal & external division of lines into given ratios
  • Parametric representation
  • Permutations combinations
  • Polynomials

Functions

ME-F1 Further Work with Functions

ME-F2 Polynomials

Trigonometric Functions

ME-T1 Inverse Trigonometric Functions

ME-T2 further Trigonometric Identities

Calculus

ME-C2 Rates of Change

Combinatorics

ME-A1 Working with Combinatorics

3 Unit HSC Course

(current in 2019)

New Mathematics Extension 1 Year 12 Course – Topics and Sub-topics (to be implemented in 2020)
  • Methods of integration
  • Primitive of sin2x and cos2x
  • Equation dN/dt= k(N-P)
  • Velocity and acceleration as a function of x
  • Projectile motion
  • Simple harmonic motion
  • Inverse functions & inverse trigonometric functions
  • Induction
  • Binomial theorem
  • Further probability
  • Iterative methods for numerical estimation of the roots of a polynomial equation
  • Harder applications of HSC 2 Unit topics

Functions

ME-F1 Further Work with Functions

ME-F2 Polynomials

Trigonometric Functions

ME-T1 Inverse Trigonometric Functions

ME-T2 Further Trigonometric Identities

Calculus

ME-C2 Rates of Change

Combinatorics

ME-A1 Working with Combinatorics

Mathematics Extension 2: Content

The table below demonstrates the changes between the previous and new syllabus.

4 Unit Course

(current until 2019)

New Mathematics Extension 2 Course – Topics and Sub-topics (to be implemented in 2020)
  • Graphs
  • Complex numbers
  • Conics
  • Integration
  • Volumes
  • Mechanics
  • Polynomials
  • Harder 3 Unit topics

Proof

MEX-P1 The Nature of Proof

MEX-P2 Further Proof by Mathematical Induction

Vectors

MEX-V1 Further Work with Vectors

Complex Numbers

MEX-N1 Introduction to Complex Numbers

MEX-N2 Using Complex Numbers

Calculus

MEX-C1 Further Integration

Mechanics

MEX-M1 Applications of Calculus to Mechanics

Assessment and examination

Advice regarding assessment and examination has been published on the  NESA website  and teachers should refer to the site regularly for updates. The most significant change is the approach to the formal school-based assessment program for Year 11 and Year 12.

School-based assessment requirements

Teachers should refer to the NESA Assessment and Reporting in Mathematics Stage 6 document. Some features of the new syllabuses include:

The Year 11 formal school-based assessment program is to reflect the following requirements:

  • three assessment tasks
  • the minimum weighting for an individual task is 20%
  • the maximum weighting for an individual task is 40%
  • one task must be an assignment or investigation-style with a weighting of 20–30%.

The Year 12 formal school-based assessment program is to reflect the following requirements:

  • a maximum of four assessment tasks
  • the minimum weighting for an individual task is 10%
  • the maximum weighting for an individual task is 40%
  • only one task may be a formal written examination with a maximum weighting of 30%
  • one task must be an assignment or investigation-style with a weighting of 15–30%.

NESA has provided the following examples of some approaches to task types for the assignment or investigation-style task:

  • an investigative project or assignment involving presentation of work in class;
  • an independently chosen project or investigation;
  • scaffolded learning tasks culminating in an open-ended or modelling style problem;
  • a guided investigation or research task involving collection of data and analysis.

Teachers can benefit from working collaboratively to plan for these new syllabuses. Access to professional learning time and resources will be essential and courses offered by the Centre for Professional Leaning are an ideal place to begin.

Terry Moriarty has been a Mathematics teacher and Head Teacher in South and South Western Sydney for forty years. He has been involved in curriculum development processes throughout his career.


A Very Useful Aspirin: Networks and the New Stage 6 Mathematics Standard Syllabus

David Watson reflects on why the new Mathematics Standard course is useful for students and explains how to teach the new Networks topic…

A problem

The problem presented by the new Mathematics Standard syllabus did not reveal itself straight away.

In preparation for the new Networks topic, I reviewed everything I could. I searched key words such as Kruskal’s Algorithm and Prim’s Algorithm in Google and reviewed the resources provided by NESA to support our programming and assessment.

In doing this work I was quickly reminded of my over-confidence while studying Network Theory at university. It was the beginning of this millennium and I was much younger and, perhaps, less wise. I was twenty-two years old and in my final year and I was amazed at how simple I found the concepts. I even remember thinking that, “I could score 100 in this course!”

Score 100, I did not.

Upon exploring these Networks concepts again now, I enjoyed feeling good at it. It was fun to experience success. Then, while exploring examples online and reviewing the syllabus further, I found the problem that I now consider the biggest danger in my programming for 2018…

It was all a very nice experience for me to return to my university days, to rediscover learning and knowledge I had thought lost or, at least, forgotten. Yet, in amongst the many applications listed in the syllabus, including travel times, power cabling and garbage bin routes, all of which made sense to me, I realised I needed to think on how to help Networks make sense for my students.

Not just make sense, but actually be useful!

To steal a metaphor from Dan Meyer, if Network Diagrams, Shortest Paths, Minimum Spanning Trees and Critical Paths are the aspirin, how do we create the headache?

So, what are we doing with Networks?

In this section, I will present some examples of approaches to introducing the new concepts and reflect on some teaching challenges that I encountered while learning about this content. At the end of the article, I will consider possible solutions to these teaching challenges.

Before you read any further, this article assumes the reader is comfortable to convert an image or table of a real world situation into a network diagram and to understand the language of Network Theory. If you need help at this level you might visit the Mathspace Essentials free, online textbook for a simple and concise explanation, as this is the first section for both the Mathematics Standard 1 (MS1) and Mathematics Standard 2 (MS2) pathways.

Konigsberg Bridge

In Mathematics Standard 2, one additional example is the Konigsberg Bridge problem. Images such as the one below are easily found via an internet search. The map of the city of Konigsberg in Prussia illustrates that the city, either side of the Pregel River and including two islands, includes seven bridges. The problem posed is whether a path can be drawn, with any starting point, so that all bridges are crossed exactly once.

Source https://en.wikipedia.org/wiki/Graph_theory#/media/File:Konigsberg_bridges.png

This bridge town and problem has many interesting elements, and essentially serves as an opportunity for students to investigate networks and practise their skills in modelling a real world situation. A possible diagram that models this situation is below. Click here to view image

The seven bridges are represented by edges and the four separate land sections are represented by vertices. The problem now becomes: “Is there a path that travels along each edge exactly once?” The answer becomes apparent after a few attempts.

It is interesting to note that Konigsberg is now called Kaliningrad and only five of the seven bridges still exist (only two in their original form). This can give rise to discussions about what this new situation does to the problem, and does it matter which of the five bridges are still in existence?

Konigsberg Bridge teaching challenge

My first teaching challenge with this new topic arose when I found it easier to ‘play’ with this problem using the original image than when I attempted to use the new diagram above. I was fortunate enough to have stumbled across the same point of view held by many of the students I have encountered in the current Mathematics General 2 course, seeing the creation of this diagram as a needless extra step.

So why draw a network?

Shortest Path

I will return to the question of drawing a network later. For now, we continue exploring, and look into the concept of Shortest Path and Minimum Spanning Trees. These are concepts that are required in both the MS1 and MS2 pathways.

The Shortest Path between two points is a fairly obvious concept if we consider the diagram below. We want to find the shortest path from vertex A to vertex B. This image is partway through the algorithm, and the numbers ‘12’, ‘15’ and ‘14’ in vertices ‘C’, ‘D’ and ‘E’ respectively represent the minimum distance to get to the first three vertices. The shortest path to ‘D’ is through ‘C’. Click here to view image.

From here we would write ‘27’ in vertex ‘F’, as the shortest distance to ‘F’ is through ‘D’. We would then write ‘31’ in vertex ‘B’, making the shortest distance from A to B equal to 31, with the shortest path being A>C>D>F>B.

Shortest Path teaching challenge

Similarly to the Konigsberg Bridge problem, I encountered my second teaching challenge here. This algorithm was effective; however, I wondered if it was particularly different to what students would do anyway? It was, in essence, an exhaustive method of solving the problem and I wondered if it was still a useful tool for students?

Minimum Spanning Trees

Once again, for now we push on and investigate Minimum Spanning Trees.

I discovered the definition: a set of edges with the minimum cost that connect all vertices together. This concept is, obviously, for weighted edges and also for undirected networks. Yet, the application felt a bit less apparent to me, and so I went searching. The syllabus provided a good recommendation of connecting towns, places or locations to a power station or phone network.

In an online search, the problem that arises most is the ‘Muddy City Problem’. This problem involves a city where the mayor has decided to pave some of the pathways between houses to allow driving access. The mayor hopes to allow for all houses to be accessed from any other house; however, the major also wants the minimum possible cost. Therefore, only the minimum spanning tree in the network will be paved. To view a diagram and free lessons for the Muddy City Problem click here.

The number of pavers in the image displays the cost of paving each road (this could be price, resources or time required, and so on). Prim’s Algorithm suggests we first select the shortest edge, and then continue by selecting the shortest ATTACHED edge. This continues until all vertices are included, and, of course, we avoid all loops. You may have already identified that there are many possible beginnings, as the more edges with equal costs in a network, the more likely we are to find equal solutions.

Kruskal’s Algorithm requires us to start with the smallest edge, and then select the next smallest edge, regardless of whether it is attached to the existing tree or not. Again we must avoid any loops. Regardless of where you begin, by the end of the process all distinct sections will link to make a tree.

A breakthrough

It was at this point that I began to see a solution to the teaching challenges outlined above. Not only were these algorithms both immediately helpful and relatively easy to follow, which was encouraging, but I noticed a key point that I thought I might be able to use. All three problems introduced above can be investigated without the use of Network Theory. They may require scaffolding for your class, but I found I could successfully introduce these problems to Stage 5 students, and all were intrigued and keen to “play” with the problem.

Critical Path Analysis

Now we move on to Critical Path Analysis, the first of two major skills required only by students following the MS2 pathway. When presented with a list of related tasks to complete a job, Critical Path Analysis supports us to analyse the situation, identify the shortest possible time taken to complete the list as well as the latest start time for certain steps without delaying the overall time.

This tool has a variety of applications. A simple one with an example I have created is baking some biscuits for afternoon tea. I enjoy this example because it could be just about any recipe, so students can create and analyse their own situation. The table below describes the steps involved, the prerequisites and the time for each step, as well as labels.

We are looking for the critical path, so we draw a network diagram, where the vertices represent a moment in time where you are available to start a new task (or tasks), and the edges represent the tasks themselves. Below is an analysis of the above table.

In the analysis, it is evident that making a cup of tea (Task G) could be started after 21 minutes, and still not delay the entire task. Mixing in eggs, flour and choc chips (Task D) could not begin until after 10 minutes.

The vertices are split in half and down the centre in my diagram (above), with the number on the left indicating the earliest time that jobs that begin from this vertex could begin. The space on the right of each vertex is reserved for the latest time that a task beginning at this vertex could begin without delaying the overall job. How to communicate this latest start time varies depending on the source you are reviewing, and by looking through a variety of textbooks as well as online industry explanations, I have seen a number of different forms of these vertices. These include circles being divided with a horizontal line, or even vertices divided into three parts.

Critical Path Analysis inspired me with applications relevant to students’ future areas of employment, as well as to their present daily lives. All we really need to consider are tasks that are dependent upon one another, and contribute to the completion of an overall job. Finally, and sometimes most challengingly, we are asking students to look for tasks that in some instances could be completed at the same time.

Maximum-Flow, Minimum-Cut Theorem

The final skill included in the new syllabus is the use of Maximum-Flow, Minimum-Cut Theorem. This is used to determine the maximum flow of something through a network. Considering the network from above from A to B, where A would be considered a source (where the flow originates from) and B considered a sink (where the flow ends). The question is what is the maximum flow that can get from A to B? The lines cutting though the diagram represent “cuts”, because they completely separate the source and the sink. Click here to view image.

The blue, curved line is the minimum cut, as it severs the connection between A and B and it cuts through a total of 19. If the numbers in this diagram represent the number of litres of water that can flow from one vertex to the next per minute, then this ‘19’ is the maximum flow per minute from A to B. The most that can flow into ‘B’ is clearly 24, and while we can easily ‘fill’ vertex ‘F’ with 4 litres per minute (min) and therefore maximise this edge (FB), there are only 15L/min worth of edges approaching ‘C’ and therefore we can only fill this with 15L per minute. This means that while CB is able to allow 20L/min to flow through, only 15L/min is available, giving us a total flow of 15 + 4 = 19.

Similar to the Critical Path Analysis, this strategy has some obvious applications, such as in the area of traffic flow, water and power. In addition, both problems are available to students to investigate without first being given the algorithms to solve. And I can feel a really pleasant headache.

So what to do about my challenges?

The question I was trying to solve while working through Network Theory was, breaking it right down, “Why?”

Not necessarily “Why is it in the course?”, although this is a question that would be answered as a result, but rather, why is it useful, and would I be able to help my students to see this usefulness? Again, if these tools are the aspirin, how could I give my students the headache?

The value of the Konigsberg Bridge problem is not discovering whether or not the bridges can be traversed without repetition, but rather, how can we prove and communicate that a solution does not exist, and why it does not exist. While ‘playing’ with the image might be more natural to students, investigating, discussing and communicating why there is no solution is best supported by the network diagram. The proof relates to the odd degree of each vertex, which is difficult to examine without first defining the vertices.

The students I have shared Shortest Path problems with have been able to investigate the problem, and generally find the solution. When subsequently shown the algorithm, the room filled with “ohhhhh”’s of realisation.

They were able to engage with the Muddy City Problem, order events in a critical path scenario and consider the maximum flow through a network. They often found solutions and could explain how they found them, yet had difficulty convincing me or themselves that this was definitely the maximum, shortest or best solution. Most importantly, their confused looks and questions of one another turned to smiles and satisfaction that there indeed was an easier and more effective way. Their headache had been relieved.

Final thoughts

Not only does allowing your students to investigate these problems first without the algorithm support them to discover the need for one, it provides a fantastic opportunity to apply problem-solving skills and communicate and justify their solutions. When an algorithm is introduced, these skills are able to be revisited and enhanced with a deep understanding of useful tools.

And that is a very useful aspirin.

David Watson is a Mathematics Head Teacher in a Sydney High School, experienced in leading teachers from all stages of their careers in syllabus analysis and program development as well as modernising and engaging the Mathematics classroom. He is a graduate of the University of Technology, Sydney and has worked in a variety of school settings, supporting students from a range of different socio-economic and cultural backgrounds. Since 2015, David has been a working party member for Lachlan Macquarie College, providing professional learning and networking opportunities for teachers as well as enrichment days for highly engaged students of Mathematics and Science.

The Making of a Teacher: Why NAPLAN is not Good Enough for Us

Richard Gill has directed the finest Australian Operas. He looks back on his time as a teacher and considers NAPLAN’s place in education today…


It might be expected that I will write about the efficacy of Music Education in the lives of children. I have written thousands and thousands of words on this subject and am always happy to do so.

However, I am now at that stage of my life where I think we have to see things as they really are.

Getting real

Quality Schools, the title of the Review to Achieve Educational Excellence in Australian Schools, or, “Gonski 2.0”, contains a sentence which says:

Australia has an excellent education system but our plateauing or declining results highlight that while strong levels of investment are important, it’s more important to ensure that funding is being used on evidence-based initiatives that are proven to boost student results.

First, we do not have an excellent education system. If we did, we would not be plateauing (such a politically correct euphemism for failing).

Why do we need to boost results? Is schooling about results? It is hard to believe that in 2018, in a world so rich with wonderful things, all we can think about in a school is results.

How insulting this is to teachers. Is that why you teach? To get results which can be measured by others?

We cannot love what we do not know

As I work to improve our music education system, I am only too well aware of forces that seemingly conspire at every turn to frustrate the creative teacher and reward narrow ‘results’.

I was drawn to teaching because I loved reading novels, poetry and plays and loved music. I still do love all these things. I am also aware that I owe debts to people who helped me directly or indirectly.

We cannot care about those things we do not love or know, and so we need, in this country, to let our teachers know that there are some of us out there who do care about you, who do share the concept of a love of learning for its own sake, who don’t give a damn about a NAPLAN score, and who will go to the barricades for you and fight for the right for you to teach children properly.

Section 582, 1958

Allow me to introduce Mrs. Holder…

Mrs. Holder, a Lecturer in English, stood at the front of our section, Section 582 at the then Alexander Mackie Teachers’ College on a frosty September morning in 1958 and uttered the immortal words which I have never forgotten:

Plan, teach, test.

Section 582, listen to me very carefully. If you don’t plan you can’t teach and if you can’t teach you can’t test and if you can’t test you have no idea what the children know. Remember – plan, teach test.

Plan, teach, test

At the age of sixteen, I was the youngest member of my section, having passed the Leaving Certificate in 1957 with Bs in English, Ancient History and Modern History and an A in French. Notice the lack of Maths and Science!

I had applied to go to the then New South Wales State Conservatorium of Music to train as a High School Music Teacher, but my complete lack of Theory and Harmony led the examining panel to suggest to me that were I to complete Sixth Grade Theory and Sixth Grade piano in that year I would be awarded a scholarship in 1959. They were as good as their word and in 1959 I made it to The Con.

In between times I had accepted a Teachers’ College Scholarship to Mackie as one couldn’t be certain of anything, and failure at tertiary level was real. No appeals, no show cause, no “I had a nose-bleed in the exam”; just fail!

So it was that as the appointments to primary schools for practise teaching period were posted, I was sent to Eastwood Primary School.

It was decided that I should be given a very difficult class of all boys, a 5D, and from day one with this class and their brilliant teacher, Mr. Peter Black, my life changed. Mrs. Holder was my supervisor so I planned, taught and tested to insanity.

I still have my three exercise books of lesson preparations with a comment given to me by Mr. Black on every lesson.

I could hardly wait to get to school each day and every day was a joy.

NAPLAN? … Anyone? … No?

So what has all of this to do with the iniquitous NAPLAN?

Even as a very young student teacher it was patently clear to me that the individual classroom teachers had an amazingly detailed knowledge of their pupils.

Morning teas and lunches in the staff room, apart from the usual banter, were often detailed discussions about children and their progress, or lack of it, indicating to me that a classroom teacher was, in fact, constantly assessing and evaluating her or his students indirectly without having to write reams of pointless information.

If a parent wanted to know something about a child, an interview was arranged with the teacher.

While there were often fireworks, some parents believing that their children were direct descendants of Einstein and the Virgin Mary, with all the attendant virtues, most parents were content with the reports which the classroom teacher could provide orally with an astonishing level of detail and depth of knowledge of the child in question.

Know thy students

On the matter of syllabus and curriculum, there were documents available for teachers to use which most of the teachers with whom I worked chose to consult rarely or chiefly ignore.

I think this was because they knew what levels their children were attaining in all areas and had realistic expectations of what they could do. In short, they created their own curricula.

The bright classes were well above average in every discipline, and a class such as mine, the fabulous 5D, was working at its own level. There was no point in doing activities or teaching concepts out of reach of the children.

On one memorable afternoon, I was given a spectacular lesson in over-reach by Mr Black.

I had spent the entire one-hour lunch break creating a solar system on the blackboard, labelling the planets, tables of figures and the like. It was a visual triumph. There was more coloured chalk in this masterpiece than Leonardo had ever dreamed of.

I gave the lesson during which I had the feeling that the kids couldn’t have cared less. At the end of the lesson Mr. Black asked me to wait behind after school to discuss what I had done.

During the discussion he said:

“These kids don’t have a concept of 10, let alone a concept of millions. The figures you gave them were meaningless to them. They have nothing to relate to and you gave them no real insights.

The use of coloured chalk, however, was very effective. See you tomorrow.”

I was shattered but knew that I had given a really dud lesson. At the same time, I was really grateful for the frank advice. Mrs. Holder, who had also sat in on the lesson, agreed and rammed home the point:

“You planned nicely but irrelevantly. You taught nothing, they learned nothing and therefore you couldn’t test them. Better luck next time.”

I still have those comments in my practice teaching exercise book lesson plans.

What worked about these times?

The points I am making are:

  1. these teachers were fundamentally autonomous;
  2. they devised their own curricula and syllabuses to suit their classes;
  3. they collaborated with each other and shared ideas;
  4. teaching was not competitive and there was no Federal interference;
  5. they enjoyed their work, in the main, and the word ‘stress’ was unknown;
  6. they knew the strengths, weaknesses and potentials of their charges;
  7. they tested officially only twice a year;
  8. a school report was a short one-page affair;
  9. no one, and in some cases not even parents, knew their charges better than the teacher.

While many of these points would still apply today, NAPLAN has destroyed collegiality, created competition, created stressed-out parents, teachers, Principals and students and, above all, has promoted a continually sliding scale of under-achievement nationally.

NAPLAN is not diagnostic. Never has been and never will be.

If the robots are permitted to take over marking students’ writing, the next idea will probably be to hire a robot to teach our children too. Creepy!

Looking to our future

No one, but no one, knows Primary school children better than the classroom teachers. Parents who think that a NAPLAN result is an indicator of a child’s abilities, capacities or potential are seriously deluded. All a parent has to do is make an appointment to see a teacher, who can give the best diagnostic information about the child.

As I travel the country teaching classes and doing workshops, I always ask teachers and Principals what they think of NAPLAN. I haven’t yet met a Primary school teacher who has a good word to say about NAPLAN. Some Principals tell me they are frightened to speak about NAPLAN because they feel they have to toe a party line.

Recently, I was giving a workshop in which my ten minute attack on NAPLAN was greeted with enthusiastic applause from the assembled teachers. At the end of the workshop a very timid teacher came up to me, looked around the room several times before whispering “Thank you for that. We are not allowed say anything about NAPLAN to anyone or we will get into trouble.”

She looked once more around the room and then fled.

I hadn’t realised until that moment that we were living in a totalitarian state.

NAPLAN is not good enough for us

Surely teachers should be encouraged to have all sorts of views about all sorts of subjects without imposing any views on their students, but encouraging them also to have views and ideas and to have all of these views without fear.

It seems to me we go to school for two reasons and two reasons only: to learn how to learn together, and to learn how to think for ourselves. NAPLAN encourages neither of those precepts. The stranglehold of literacy and numeracy has hijacked all serious learning and enquiry.

Literacy and numeracy are NOT disciplines or subjects. They are states or conditions at which one arrives as a result of being well educated.

Schools which abandon their Arts disciplines in favour of more time given to literacy and numeracy are betraying their children, insulting their teachers, depriving their children’s minds of genuine creative growth, limiting their imaginations and training them to be all the same.

Music, Art, Dance, Drama and so on are essential in the life of a child. It is through endless hours of play, fantasy, imaginative games, songs, dances, painting and the like that children begin to make sense of the world. Stories, nursery rhymes, nonsense rhymes, acting out little scenes, together with the other activities already mentioned, are the stuff and lifeblood of education. Children engaged in these activities learn to love learning.

This attitude to education is recognised in countries which seem to perform consistently well in all areas of learning. Have we anything to learn from them? Or are we too busy testing First Grade children?

Why are we so obsessed with assessment? Why the absence of commensurate treatment following this relentless ‘diagnosis’?

Why aren’t we as a nation totally devoted in our education programs to those disciplines which promote creative and imaginative thinking, and lead children down the genuine path to literacy and numeracy?

Hope

I’ve seen in this country some brilliant creative teaching which fired up the minds of the children in an extraordinary way. It was inspiring at every level and something every teacher could do.

Teachers need to stand up and be counted and we need to rid this country of an iniquitous and destructive assessment system. I am not suggesting for one minute that children shouldn’t be tested; remember Mrs. Holder’s wise advice: plan, teach, test. Simply that, in very early education testing is the job of the teacher, not some outside authority who has no real idea of your classroom.

Recently, I attended a Kindergarten assembly at which each child had a specific sentence to read. What was brilliant was that the teacher had devised the sentences according to each child’s ability so that each child was successful in the eyes of the school community.

Why is this brilliant? Because it meant that the teacher was very well aware of what his children could do and he didn’t need an outside authority to help him.

Let’s all aim for a NAPLAN-free future and a return to teacher autonomy accompanied by appropriate fiscal remuneration for all good teachers.

Life is short and art is long. The minds, souls, hearts and imaginations of our children are immeasurable, priceless, invaluable and bursting with ideas. I want to hear those ideas so I can learn something too.

Richard Gill AO, founding Music Director and Conductor Emeritus of Victorian Opera, is one of Australia’s most admired conductors and music educators. He has been Artistic Director of the Education Program for the Sydney Symphony Orchestra, Artistic Director of OzOpera, Artistic Director and Chief Conductor of the Canberra Symphony Orchestra, and Artistic Advisor for the Musica Viva Education program. He is the Founder and Director of the National Music Teacher Mentoring Program, Music Director of the Sydney Chamber Choir and the inaugural King & Wood Mallesons Conservatorium Chair in Music Education, at the Conservatorium High School, Sydney.

“Perhaps it’s just as well that Leonard Bernstein is dead. Otherwise he’d probably have to relinquish his great reputation as a musical educator – or at least share it with Sydney’s Richard Gill.”

John Carmody, The Sun Herald

An Introduction to the New Mathematics Standard and Life Skills Syllabuses

Terry Moriarty introduces the new Stage 6 Mathematics syllabuses which are implemented for Year 11 in 2018…

The new NSW Stage 6 Mathematics Standard and Life Skills Syllabuses were endorsed in 2016. 2017 is a planning year with implementation for Year 11 in 2018 and Year 12 in 2019. The new Mathematics Advanced, Extension 1 and Extension 2 syllabuses will be released following an additional period of consultation and the JPL will provide a guide in the Semester 2, 2017 edition.

Due to the online nature of the syllabus documents, teachers are encouraged to download and review each section, including the aim and rationale before moving to the course content.

New features of Stage 6 syllabuses include:

  • Australian Curriculum content identified by codes;
  • Learning Across the Curriculum content, including cross-curriculum priorities and general capabilities;
  • publication in an interactive online format;
  • an interactive glossary.

Initial information regarding assessment has been published by the NSW Education Standards Authority (NESA). The most significant change is the approach to the formal school-based assessment program for Year 11 and Year 12. Examination specifications are expected to be available in Term 3, 2017.

Mathematics Standard

The Year 11 courses

Organisational structure

Mathematics Standard replaces the previous General Mathematics syllabus. There is a new organisational structure as well as updates to content.

The course is organised into topics with the topics divided into subtopics. Students can complete common content in Year 11 and then move into either Year 12 Mathematics Standard 1 or Year 12 Mathematics Standard 2.

Alternatively, teachers have flexibility within the common Year 11 content to address material that is essential for Mathematics Standard 1 in Year 12. This content is clearly indicated with a diamond symbol throughout the Year 11 syllabus content.


The content

The Year 11 content is common and there are no longer focus studies. Some of the topics from the previous focus studies have been retained within the topics, such as Plan for the Running and Maintenance of a Car within the subtopic Money Matters and so existing resources may still be of use.

Modelling and applications are now an integral part of each strand and also merge strands together. The table below demonstrates the changes between the previous and new syllabus structures:

General Preliminary Course

(current in 2017)

New Standard Year 11 Course (to be implemented in 2018) Topics and Subtopics

Financial Mathematics

Data and Statistics

Measurement

Probability

Algebra and Modelling

(FS) Communication

(FS) Driving

Algebra

MS-A1 Formulae and Equations
MS-A2 Linear Relationships

Measurement

MS-M1 Applications of Measurement
MS-M2 Working with Time

Financial Mathematics

MS-F1 Money Matters

Statistical Analysis

MS-S1 Data Analysis
MS-S2 Relative Frequency and Probability

School-based assessment requirements

Teachers should refer to the NESA Assessment and Reporting in Mathematics Standard Stage 6 document at: http://syllabus.bostes.nsw.edu.au/mathematics-standard-stage6/ . Teachers are encouraged to refer to the relevant NESA documents for updates. Some features for the new syllabuses include:

The Year 11 formal school-based assessment program is to reflect the following requirements:

  • three assessment tasks
  • the minimum weighting for an individual task is 20%
  • the maximum weighting for an individual task is 40%
  • one task must be an assignment or investigation-style with a weighting of 20–30%.

NESA has provided the following examples of some approaches to task types for the assignment or investigation-style task:

  • an investigative project or assignment involving presentation of work in class
  • an independently chosen project or investigation
  • scaffolded learning tasks culminating in an open-ended or modelling style problem
  • a guided investigation or research task involving collection of data and analysis.

The Year 12 courses

The Mathematics Standard courses are Board Developed Courses and so students can achieve an HSC if they complete the course.

The content

Mathematics Standard 1

The table below demonstrates the changes between the previous and new syllabus structures:

General HSC Course

(Current until 2018)

New Standard 1 Year 12 Course (to be implemented in 2019) Topics and Subtopics

Financial Mathematics

Data and Statistics

Measurement

Probability

Algebra and Modelling

(FS) Design

(FS) Household Finance

(FS) The Human Body

(FS) Personal Resources Usage

Algebra

MS-A3 Types of Relationships

Measurement

MS-M3 Right-angled Triangles
MS-M4 Rates
MS-M5 Scale Drawings

Financial Mathematics

MS-F2 Investment
MS-F3 Depreciation and Loans

Statistical Analysis

MS-S3 Further Statistical Analysis

Networks

MS-N1 Networks and Paths

Mathematics Standard 2

The table below demonstrates the changes between the previous and new syllabus structures:


General HSC Course

(Current until 2018)

New Standard 2 Year 12 Course (to be implemented in 2019)

Topics and Subtopics

Financial Mathematics

Data and Statistics

Measurement

Probability

Algebra and Modelling

(FS) Health

(FS) Resources

Algebra

MS-A4 Types of Relationships

Measurement

MS-M6 Non-right-angled Trigonometry
MS-M7 Rates and Ratios

Financial Mathematics

MS-F4 Investments and Loans
MS-F5 Annuities

Statistical Analysis

MS-S4 Bivariate Data Analysis
MS-S5 The Normal Distribution

Networks

MS-N2 Network Concepts
MS-N3 Critical Path Analysis

School-based assessment requirements

Teachers should refer to the NESA Assessment and Reporting in Mathematics Standard Stage 6 document for updates. Some features for the new syllabuses include:

The Year 12 formal school-based assessment program is to reflect the following requirements:

  • a maximum of four assessment tasks
  • the minimum weighting for an individual task is 10%
  • the maximum weighting for an individual task is 40%
  • one task may be a formal written examination with a maximum weighting of 30%
  • one task must be an assignment or investigation-style with a weighting of 15–30%.

Life Skills

The Life Skills course has been re-written to align with the new topics in Standard Mathematics: Measurement, Algebra, Financial Mathematics, Statistical Analysis, and Networks.

Teachers may choose the most relevant aspects of the content to meet the particular needs of individual students and identify the most appropriate contexts for the student to engage with the outcomes, for example, school, community or workplace. Students will not be required to complete all of the content to demonstrate achievement of an outcome.

In implementing the new syllabuses for Stage 6 Mathematics, the importance of collaboration of teachers between schools and within faculties will be essential. Professional learning opportunities such as those conducted by the Centre for Professional Learning will also be useful in supporting these processes. For more information visit: http://cpl.asn.au/

Terry Moriarty has been a Mathematics teacher and Head Teacher in South and South Western Sydney for forty years. He has been involved in curriculum development processes throughout his career.

Engagement and Mathematics: What does it look like in your classroom?

Catherine Attard continues her guidance about making Maths come alive in your primary classroom…

What does it look like, feel like and sound like when your students are deeply engaged in a mathematics task? What is it like when they are disengaged? In my previous article for the JPL I provided a definition of engagement as a multidimensional construct, consisting of three domains: operative, cognitive and affective. The coming together of the three domains leads to students feeling good, thinking hard, and actively participating in their Mathematics learning (Fair Go Team NSW Department of Education and Training, 2006; Fredericks, Blumenfeld & Paris, 2004).

I also provided a discussion on the importance of establishing positive pedagogical relationships as a foundation for student engagement in Mathematics. In this paper I will move beyond pedagogical relationships to discuss what happens in practice – the pedagogical repertoires that promote positive student engagement.

The following figure (Figure 1) is an excerpt from the Framework for Engagement (FEM), (Attard, 2014), which provides a summary of the critical elements of engaging pedagogies.
 

In an engaging Mathematics classroom pedagogical repertoires mean:


  • there is substantive conversation about mathematical concepts and their applications to life;
  • tasks are positive, provide opportunity for all students to achieve a level of success and are challenging for all;
  • students are provided an element of choice;
  • technology is embedded and used when appropriate to enhance mathematical understanding through a student-centred approach to learning;
  • the relevance of the mathematics curriculum is explicitly linked to students’ lives outside the classroom and empowers students with the capacity to transform and reform their lives.

Mathematics lessons regularly include a variety of tasks that cater to the diverse needs of learners

                         Figure 1: Engaging Repertoires (Attard, 2014)

What do these elements look like in practice? I will expand on each of the points illustrated in Figure 1, and provide some practical advice on how the pedagogies can be applied.

Firstly, how do we provide opportunities for substantive conversations between students and the teacher, and amongst students? If you consider a traditional approach to teaching where the Mathematics lessons are based on a drill and practice approach, it is difficult to see where important mathematical conversations can take place. However, consider an approach where collaboration is encouraged through problem solving and investigation, and where student reflection is an integral aspect of every Mathematics lesson, regardless of the types of tasks and activities implemented.

We must also consider the Working Mathematically components of our K-10 Mathematics Syllabus (Board of Studies New South Wales, 2012). Promoting substantive conversation allows students access to each of the five components: Reasoning, Communicating, Understanding, Fluency and Problem Solving, and provides teachers with opportunities to assess them.

The provision of tasks that provide opportunity for all students to succeed can be a challenge for teachers. It is often difficult to differentiate activities to ensure the diversity of academic ability is not only addressed, but provides sufficient challenge. Learners need to experience success and a sense of achievement if they are to develop a positive attitude towards Mathematics. One way of ensuring all learners are challenged is to provide open-ended, rich tasks rather than closed problems that only have one correct answer or limited opportunities to apply a range of strategies.

Allowing student choice in the Mathematics classroom is an important element of engagement and sends important messages relating to power and control. You can provide choice by having alternative activities within a specific mathematical content area, or you can have students choose how they present their work. Perhaps students may choose to work with concrete materials or interact with appropriate technology. This does not have to occur in every lesson, but allowing students the freedom to make choices every now and then can contribute to their overall engagement.

Technology has become an integral part of contemporary life, and as such, our curriculum requires us to use it meaningfully to enhance the teaching and learning of Mathematics. The challenge with using technology in Mathematics lessons, however, is to ensure that we promote a student-centred approach. If you take for example, the interactive whiteboard, consider how it positions the teacher. The whiteboard is fixed and usually located at the front of the classroom. Any interactivity usually occurs between one person (often the teacher), and the whiteboard. The teacher has control and students are generally passive (Attard & Orlando, 2014). How can this engage all learners?

Many schools have introduced 1:1 laptop or tablet programs, however there is a danger that the devices may be used simply as a replacement for a traditional textbook or as a word-processing device to replace pen and paper. Online Mathematics programs provide some functional improvement to textbooks, however the opportunities for students to collaborate and become involved in substantive mathematical conversations is limited.

Fortunately, the introduction of mobile technologies such as tablets has now provided us with rich opportunities to develop highly engaging, student-centred mathematical activities and tasks.

The use of contemporary technologies in Mathematics lessons provides opportunities to illustrate the relevance of Mathematics and bridge the digital divide between the school and students’ lives outside school. However, it does not necessarily mean students will be engaged. Caution must be taken to ensure the use of technology is driven by good pedagogy, rather than the technology becoming the focus of the lesson. Other ways to illustrate the relevance of Mathematics is to, where possible, embed mathematical concepts into real-life contexts and allow opportunities for students to apply Mathematics in meaningful and purposeful ways. This not only deepens mathematical understanding but will enhance engagement. Of course, as mathematical concepts become more abstract in the senior years it is not always possible or practical to apply all concepts to real-life contexts, however if students have developed a love of Mathematics through quality practices, their engagement will be sustained.

The final aspect of the FEM relating to pedagogical repertoires refers to the provision of variety within Mathematics lessons. Although young students do require some structure, variety can be provided within that structure. For example, in the primary classroom children can be presented with a range of tasks that use a range of resources. Sometimes Mathematics lessons can be conducted outside the classroom – consider running a maths trail at your school where students can participate in interesting mathematical investigations based upon their physical surroundings.  Explore the use of tools such as Thinkers’ Keys (Attard, 2013) to provide Mathematics tasks that are open-ended and creative, and set homework that takes advantage of the Mathematics in students’ lives, rather than drill and practice activities.

I have provided a brief exploration of engaging pedagogies that are listed in the Framework for Engagement with Mathematics (FEM), (Attard, 2014). Engagement with Mathematics during the compulsory years of schooling is critical if students are to develop an appreciation for and understanding of the value of Mathematics learning. Students who are engaged are more likely to learn, find the experience of schooling more rewarding, and more likely to continue with higher education. How can you adapt your practices so that your students value the Mathematics they are learning and see connections between the Mathematics they do at school and their own lives beyond the classroom now and in the future?

References:

Attard, C. (2014). “I don’t like it, I don’t love it, but I do it and I don’t mind”: Introducing a framework for engagement with mathematics. Curriculum Perspectives, 34(3), 1-14

Attard, C. (2013). Engaging maths: Higher order thinking with thinkers’ keys. Modern Teaching Aids: Brookvale

Attard C, & Orlando J, 2014, Early career teachers, mathematics and technology: device conflict and emerging mathematical knowledge. In J. Anderson, M. Cavanagh, & A. Prescott, Curriculum in Focus: Research Guided Practice, proceedings of the Mathematics Education Research Group of Australasia annual conference, pp 71-78. MERGA: Sydney

Board of Studies New South Wales. (2012). Mathematics K-10 syllabus.   Retrieved from http://syllabus.bos.nsw.edu.au/

Fair Go Team NSW Department of Education and Training. (2006). School is for me: pathways to student engagement. Sydney: NSW Department of Education and Training, Sydney, Australia.

  Fredricks, J. A., Blumenfeld, P. C., & Paris, A. H. (2004). School engagement: Potential of the concept, state of the evidence. Review of Educational Research, 74(1), 59 -110

  Dr Catherine Attard worked as a school teacher and proceeded to complete a PhD on student engagement. She has been a part of the Fair Go Project Team at the University of Western Sydney. She is also editor of the journal Australian Primary Mathematics Classroom.

Catherine Attard conducts a weekly blog at http://engagingmaths.co/about/?blogsub=confirming#blog_subscription-3  that has a number of resources that teachers are able to access and use.”

Getting Passionate About Maths

Catherine Attard explores some strategies to increase student engagement in Maths …

“I like having a teacher who is really passionate about maths”: Getting students to engage with mathematics through positive pedagogical relationships

How often do teachers of Mathematics hear the phrase “why do I need to learn this?” or “I’m no good at Maths”? Many people attribute anxiety or a dislike of Mathematics to their experiences during the middle years of schooling (Years 5 to 8) and although students are influenced to some degree by parents and peers, it is the teacher who has the most influence on students’ engagement with mathematics. This article explores the construct of engagement as it relates to Mathematics, and suggests that for deep and sustained engagement to occur, positive pedagogical relationships, the interpersonal relationships between teachers and students that optimise engagement, must first be established.

Defining engagement

As teachers, we use the term ‘engagement’ often, but do we really understand what real engagement looks like? When we see students who are ‘on task’, are they engaged, or are they just involved in busy work, and in getting the task done? Consider the difference between students who are ‘on task’, and students who ‘in task’. When students are ‘in task’, their minds and bodies are focused on what they are doing. They might be participating in substantive dialogue about the topic, or they might be working in silence, thinking deeply about Mathematics they are involved in – either way, they are engaged.

Many definitions of engagement are found in education literature. Some provide a narrow view that relates only to behaviour and participation. Others provide a deeper understanding that is multi-dimensional. Fredricks, Blumenfeld and Paris (2004), define engagement as a deeper student relationship with classroom work, multi-faceted and operating at cognitive, emotional, and behavioural levels. In this paper, I draw on work of the Fair Go Project (Fair Go Team NSW Department of Education and Training, 2006) and define engagement as the coming together of three facets – cognitive, operative, and affective, which leads to children valuing and enjoying, and actively involved with school mathematics, and seeing connections between the Mathematics they do at school, and their own lives beyond the classroom now and in the future.

Pedagogical relationships and mathematics

This paper is informed by a longitudinal study on the influences on engagement (for a more in depth description see Attard, 2011, 2013, in print). In the study, data were collected from a group of 20 children across three years of their schooling from Year 6 to Year 8. The major selection criterion for participation in this project was that the students had to identify themselves as being engaged with Mathematics (through the use of a Motivation and Engagement Scale (Martin, 2008).  Data were collected through individual student and teacher interviews, student focus groups, and classroom observations.

During the first phase of the study when the students were still attending primary school, they identified their current teacher as someone they perceived to be a good Mathematics teacher. They articulated several attributes directly relating to the pedagogical relationships the teacher had formed with her students, such as her ability to cater to individual needs through the differentiation of tasks, and her modeling of enthusiasm and passion towards Mathematics. Comments such as these were typical: “I like having a teacher who is really passionate about Maths” (Alison, Year 6), and “…while you’re doing the work she also has fun teaching the Maths as well” (Tenille, Year 6).

In the second phase of the study, things changed for this group of students. They began their secondary education, at a new school that was significantly different at the time from traditional secondary schools. At the time the school identified itself as a ‘ground breaking’ learning community in relation to its multi-disciplinary approach to curriculum, large open teaching spaces and a teaching structure that saw a group of Mathematics teachers rotate amongst classes, which meant each class group did not have one allocated teacher and saw each teacher every fourth lesson. These structures were not conducive to building relationships – the teachers had very limited opportunities to identify student needs and abilities, and as a result, students became disengaged: “everyone’s excited when there’s no Maths. I think it’s because, not having someone explain it to you and you don’t get it. If you don’t get it that means you don’t like it” (Kristy, Year 7).

Fortunately circumstances improved for the students in Year 8. Teachers were allocated a class group and the students were back on the path to engagement. They felt that they were now seen as individuals rather than a collective, and teachers cared more about their learning. They also felt that if they required assistance from their teachers, they felt safe in asking for help and felt the teachers now wanted to help them. The increased opportunity to develop pedagogical relationships also improved the level of feedback students received, which began to re-build their confidence as well as their engagement.

During the course of the study the students experienced a wide range of teaching and learning situations that resulted in significant fluctuations of their engagement levels. Although the data overwhelmingly confirmed the teacher was the strongest influence on these students’ engagement, this influence appeared to be complex, consisting of two separate yet inter-related elements: pedagogical relationships and pedagogical repertoires. Pedagogical repertoires refer to the day-to-day teaching practices employed by the teacher.

Results of this study suggest that it is difficult for students to engage with Mathematics without a foundation of strong pedagogical relationships. Positive pedagogical relationships exist when:

• students’ backgrounds and pre-existing knowledge are acknowledged and contribute to the learning of others;
• interaction among students and between teacher and students is continuous;
• the teacher models enthusiasm and an enjoyment of Mathematics and has a strong Pedagogical Content Knowledge;
• the teacher is aware of each student’s abilities and learning needs; and
• feedback to students is constructive, purposeful and timely.

It can also be argued that it is through engaging pedagogies that positive pedagogical relationships are developed, highlighting the connections between relationships and engaging repertoires. So what are considered engaging pedagogies in the Mathematics classroom? These will be explored in the next issue of The Journal of Professional Learning.

Catherine Attard worked as a school teacher and proceeded to complete a PhD on student engagement. She has been a part of the Fair Go Project Team at the University of Western Sydney. She is also editor of the journal Australian Primary Mathematics Classroom.

Catherine Attard, University of Western Sydney
c.attard@uws.edu.au

References:

Attard, C. (2011). “My favourite subject is maths. For some reason no-one really agrees with me”: Student perspectives of mathematics teaching and learning in the upper primary classroom. Mathematics Education Research Journal, 23(3), 363-377.
Attard, C. (2013). “If I had to pick any subject, it wouldn’t be maths”: Foundations for engagement with mathematics during the middle years. Mathematics Education Research Journal, 25(4), 569-587.
Attard, C. (in print). “I don’t like it, I don’t love it, but I do it and I don’t mind”: Introducing a framework for engagement with mathematics. Curriculum Perspectives.
Fair Go Team NSW Department of Education and Training. (2006). School is for me: pathways to student engagement. Sydney: NSW Department of Education and Training, Sydney, Australia.
Fredricks, J. A., Blumenfeld, P. C., & Paris, A. H. (2004). School engagement: Potential of the concept, state of the evidence. Review of Educational Research, 74(1), 59 -110.
Martin, A. J. (2008). Motivation and engagement Scale: High school (MES-HS) test user manual. Sydney: Lifelong Achievement Group.

Recent Posts

    Recent Comments

    No comments to show.

    Archives

    No archives to show.

    Categories

    • No categories

    QUICK LINKS

    QUICK LINKS

    Join The Union

    Courses

    Journal

    Podcast

    Contact Us

    Share this page

    About

    Who we are

    What we do

    Presenters

    FAQ

    Professional Learning

    Courses

    Journal

    Podcast

    Policy and Guidelines

    Privacy Policy

    Social Media Guidelines

    Our Ethics

    Useful Links

    About

    Head Office Details

    Member Portal

    Media Releases

    Become a member today

    NSW Teachers Federation

    Connect with us

    © 2021 New South Wales Teachers Federation. All Rights Reserved. Authorised by Maxine Sharkey, General Secretary, NSW Teachers Federation, 23-33 Mary St. Surry Hills NSW 2010.